Note
The same content is also available at GoogleDoc? https://docs.google.com/document/d/1YRbD7URQ9FRk3qGQE54QHO3wOAMTRnCPopcV4moW9iM/edit?usp=sharing Some images are omitted, as they are too big to fit. It is encouraged to read in the GoogleDocs? for the most up-to-date and comprehensive information.
Introduction
This document will outline the current state of VLO data workflow and make a suggestion to optimise it in the central services. It can be also seen as a more detailed and comprehensive view of the existing diagram https://trac.clarin.eu/attachment/wiki/MDQAS/MDflow.png. The main idea is to introduce a Dashboard which connects to different modules developed in CLARIN. In particular, it includes OAI harvester and curation module which are two of the core modules to realise the Dashboard. If you are familiar with the current workflow, you can skip the following section.
Current VLO data workflow

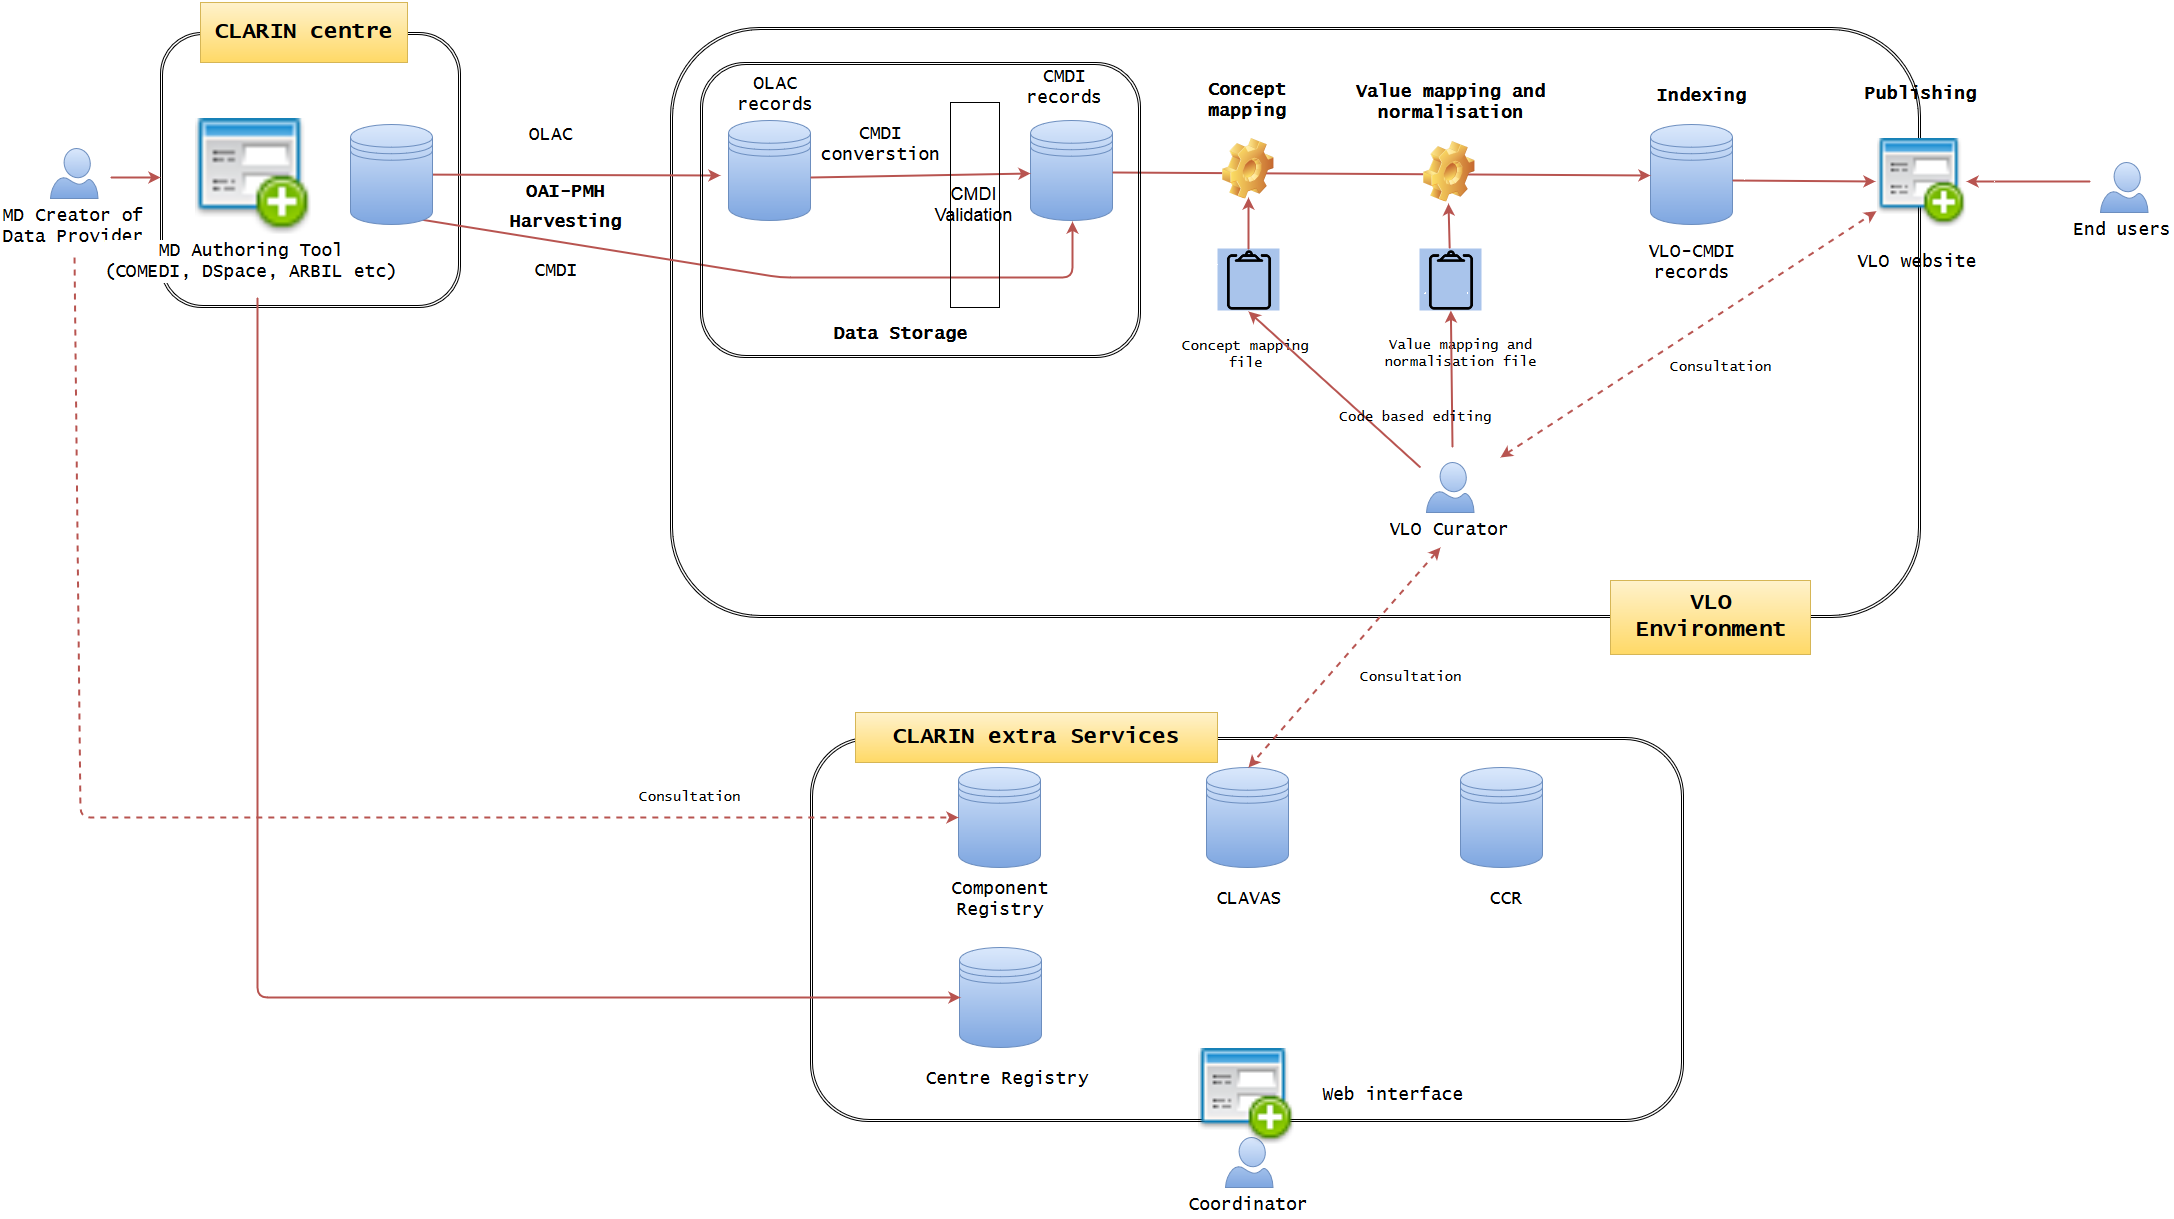
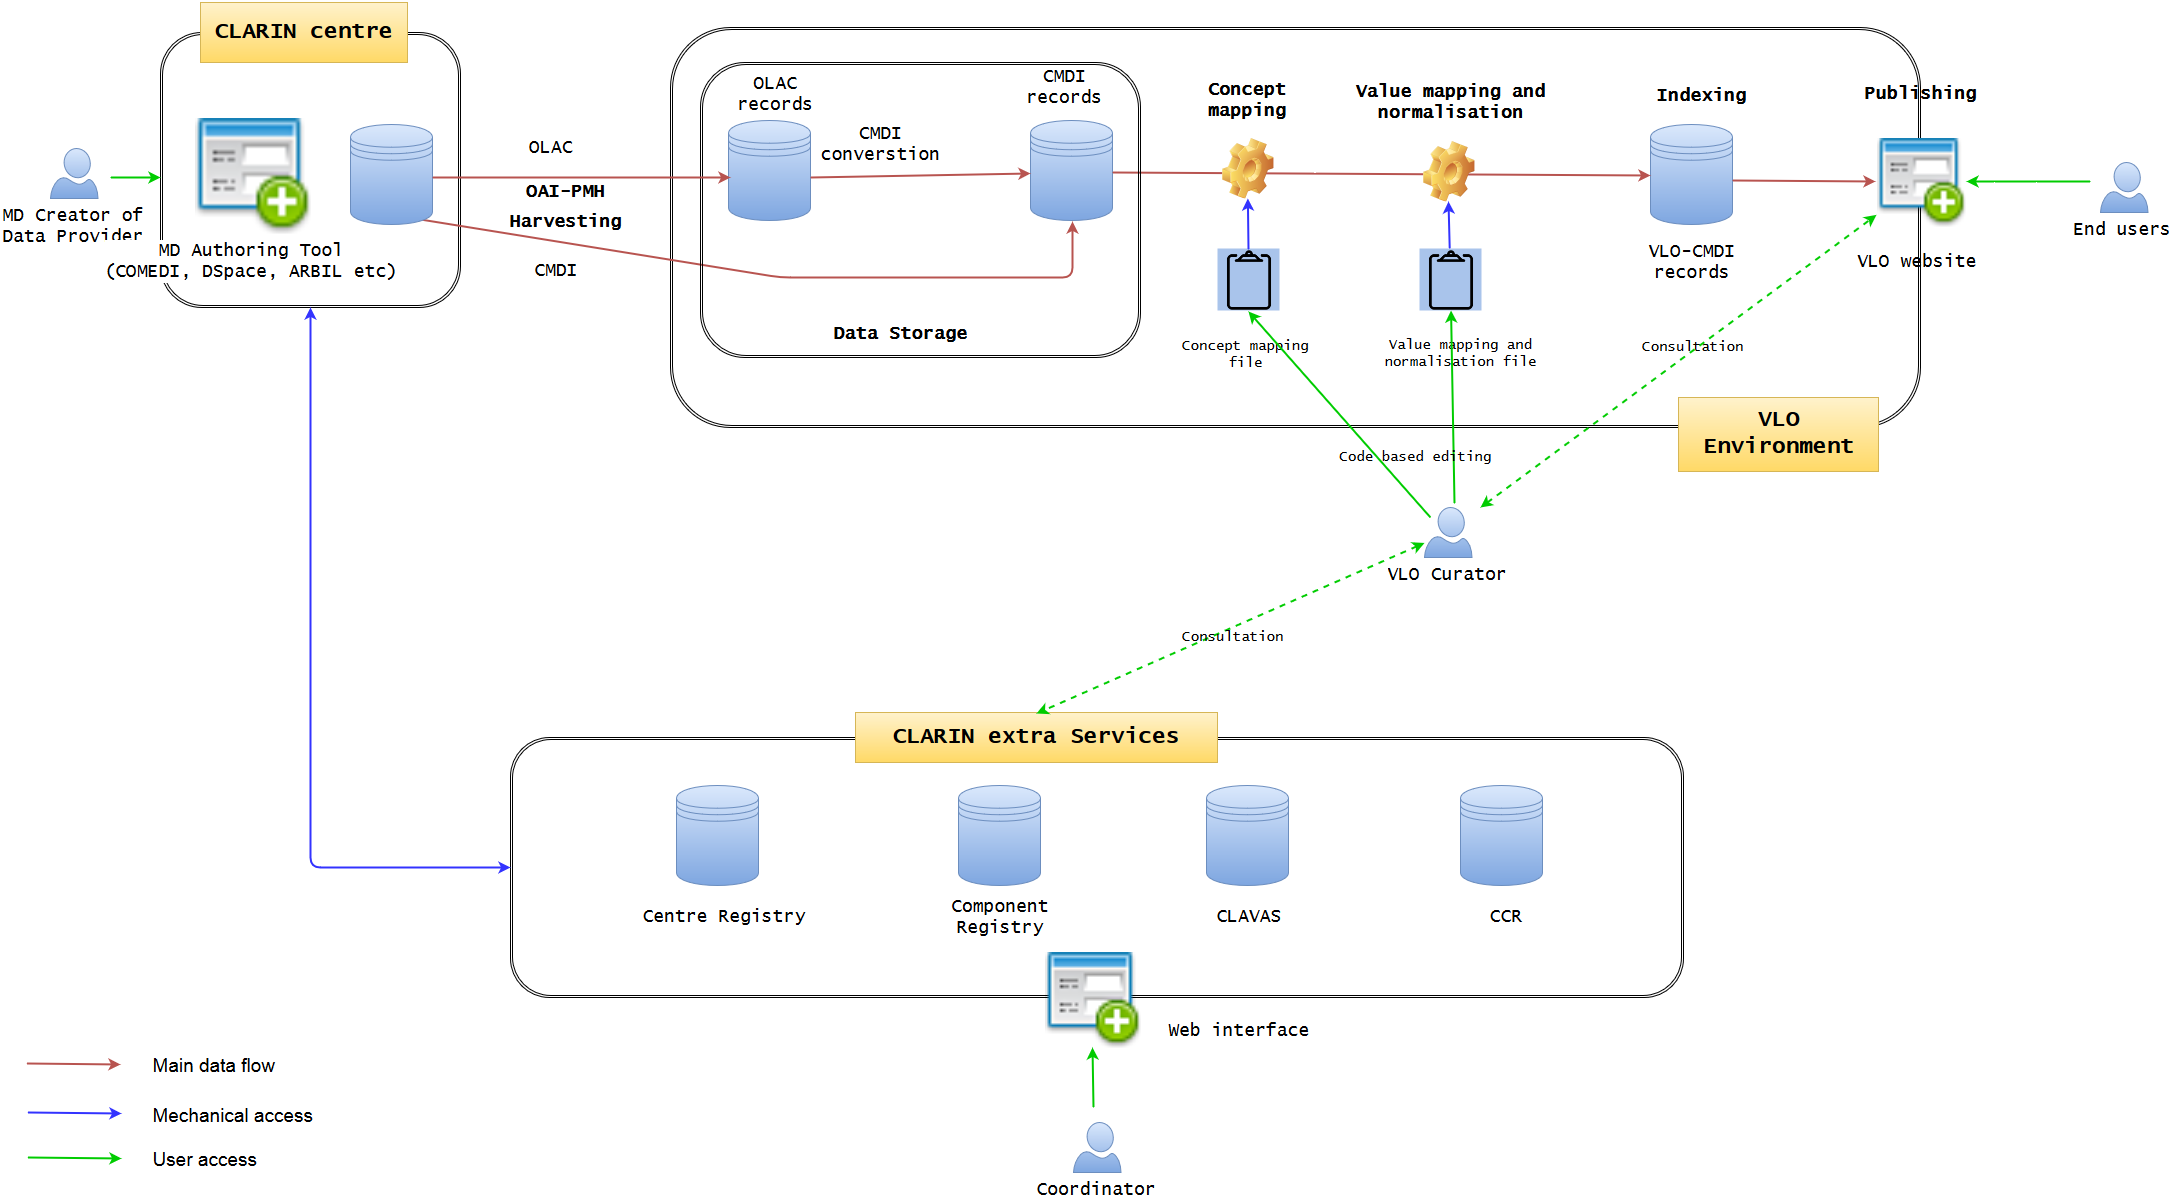
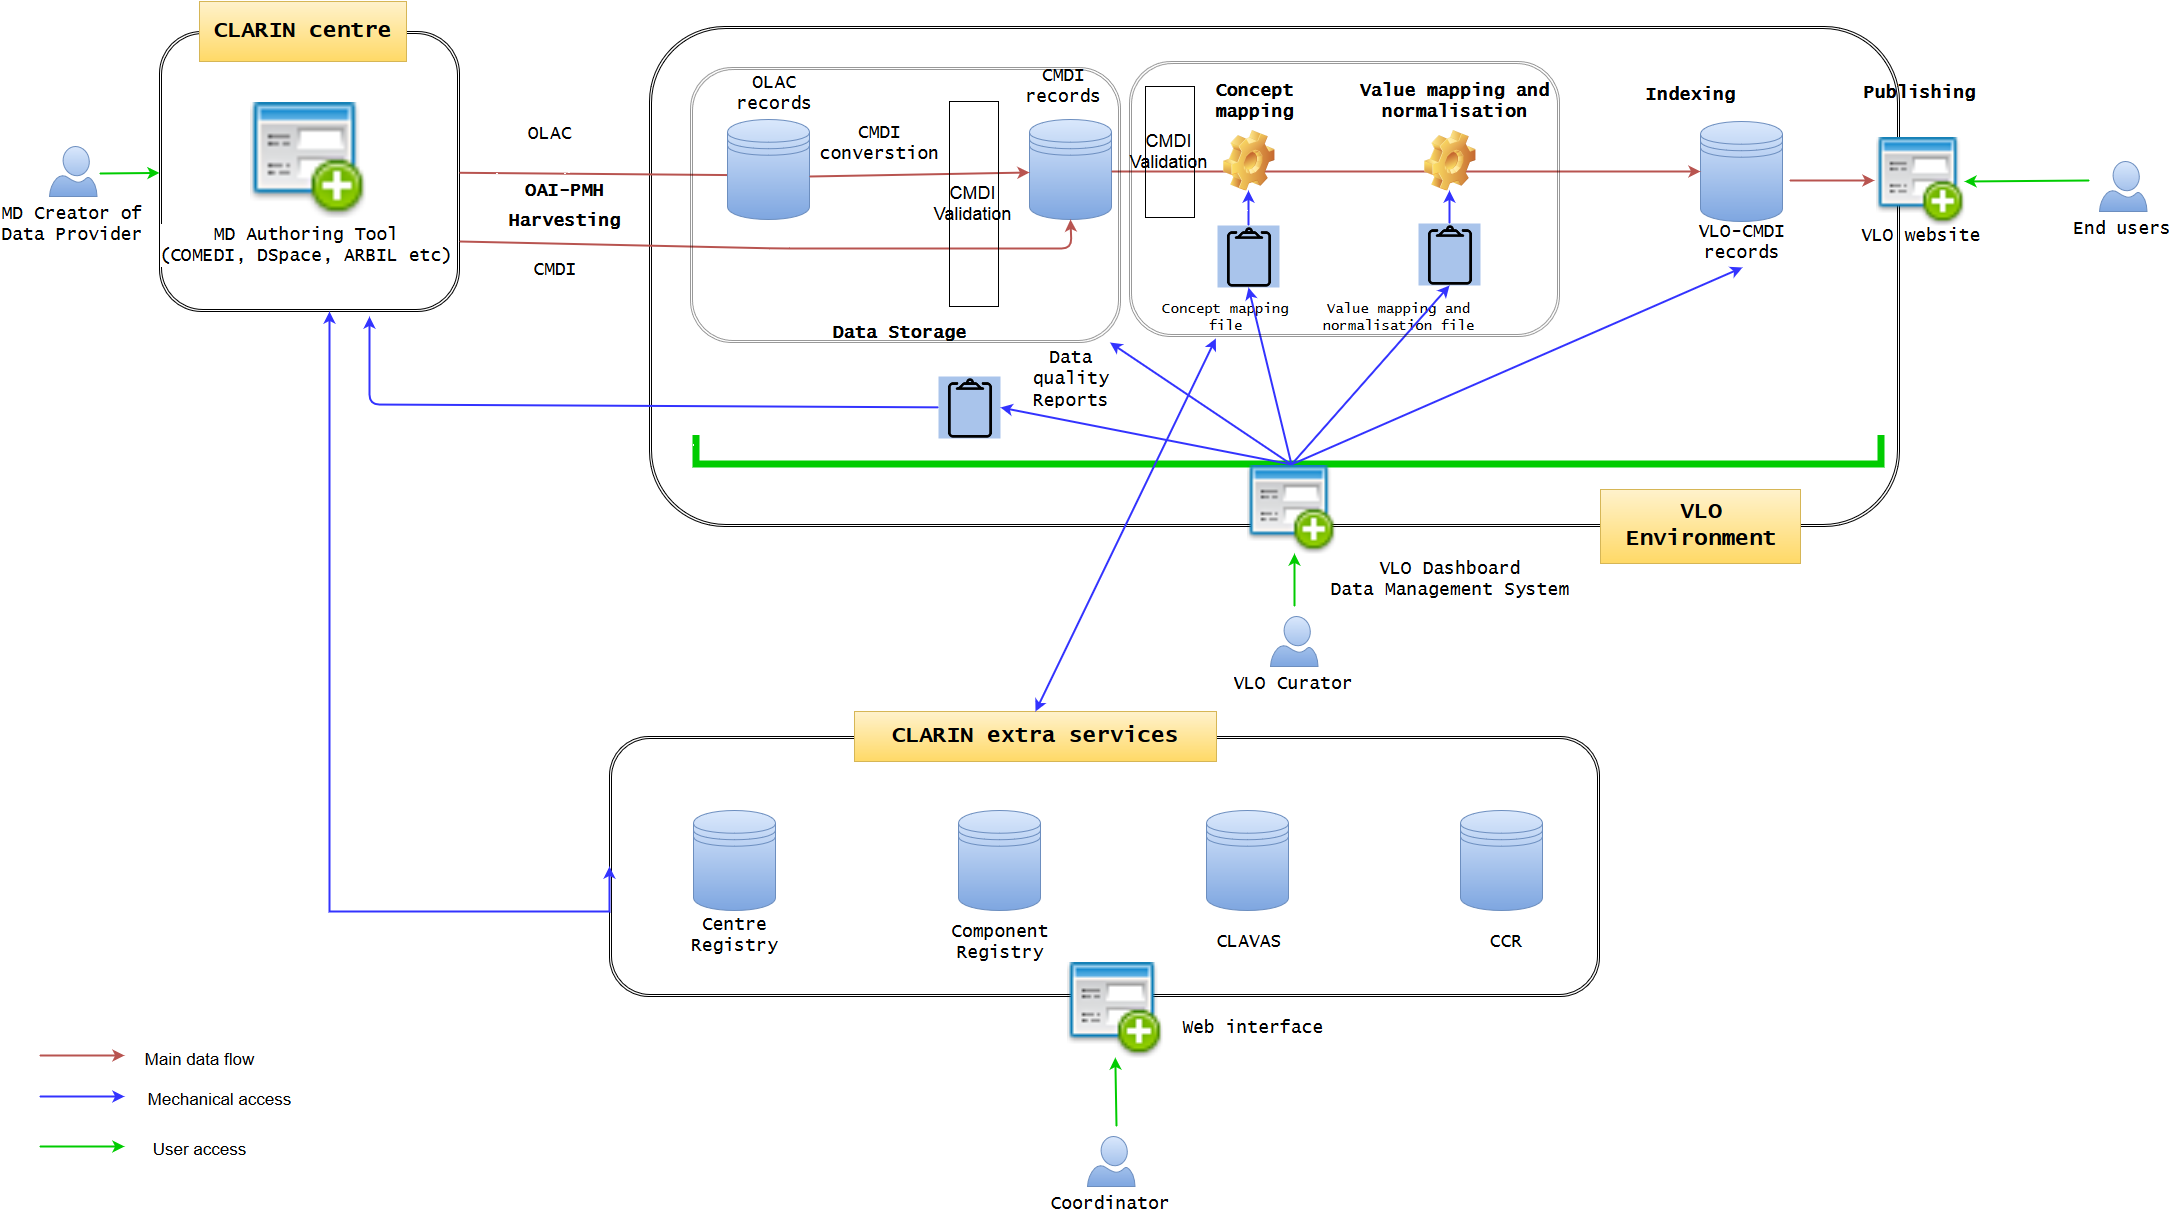
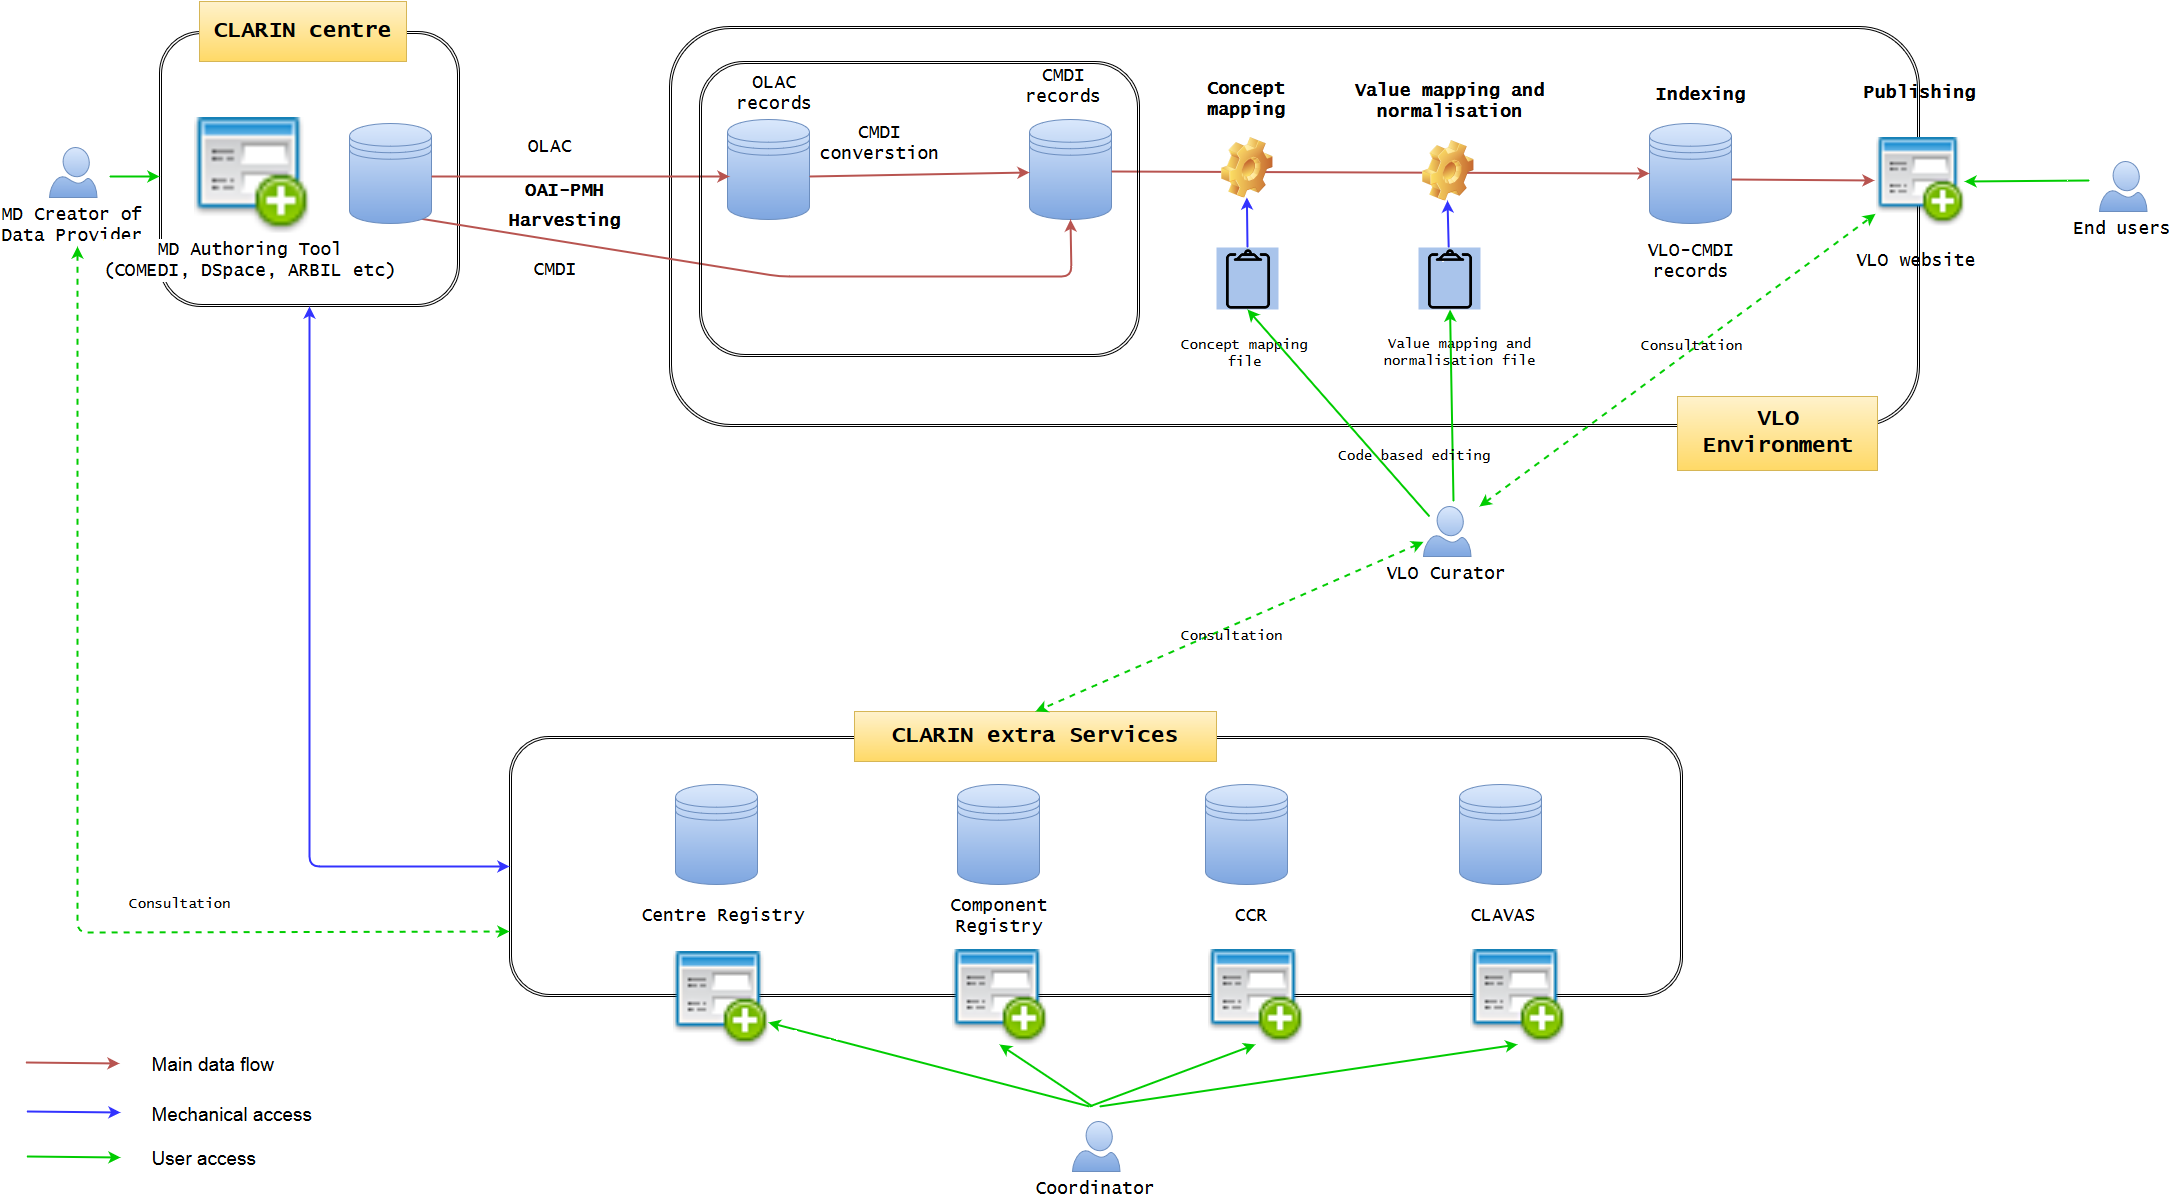
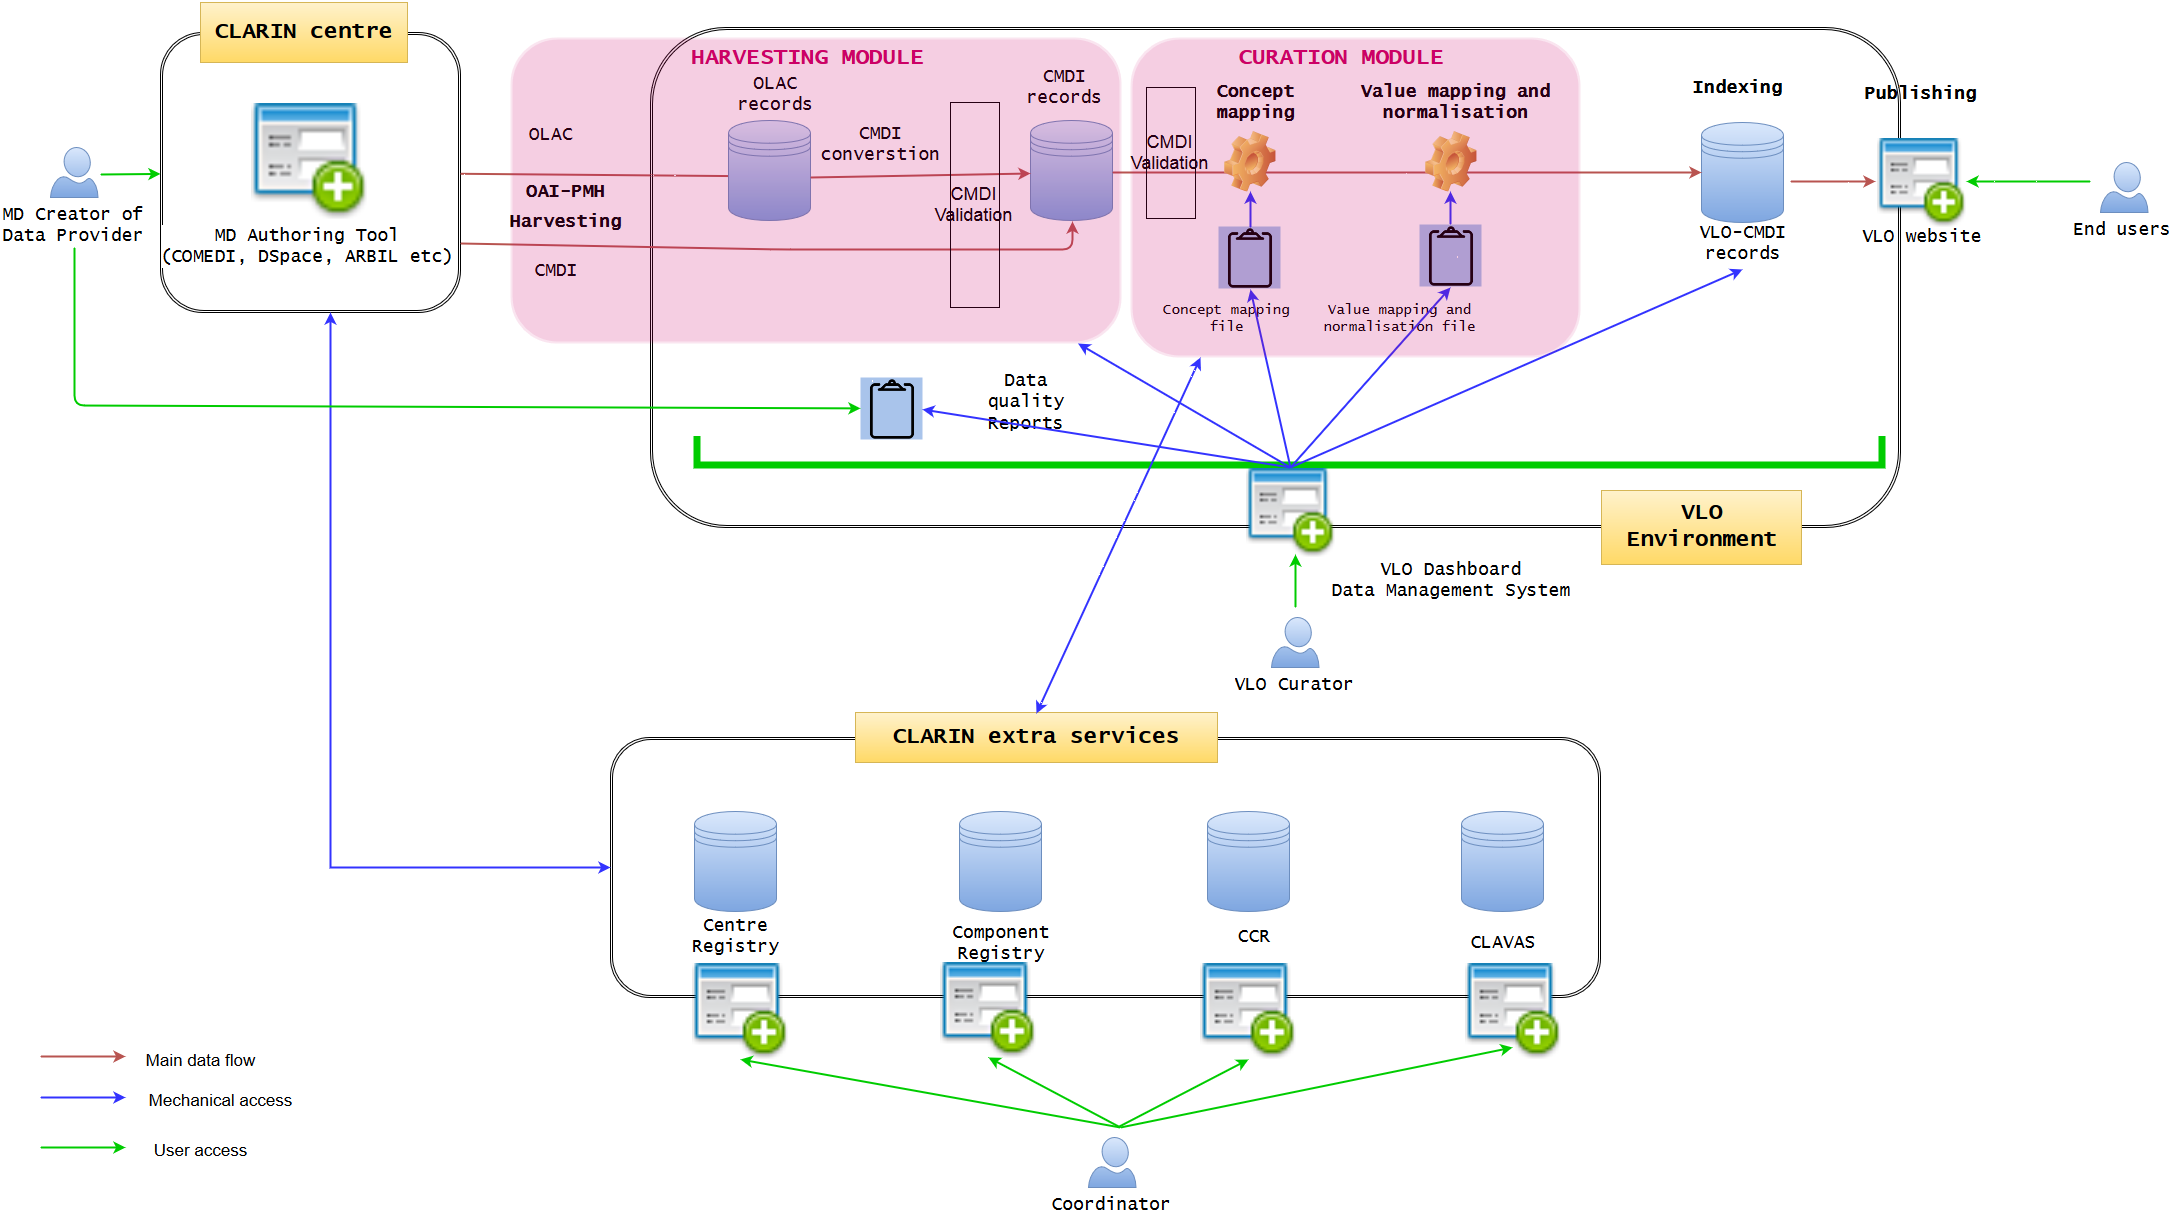
Figure 1. Current VLO data workflow (may not be 100% accurate)
Figure 1 illustrates the current state of data workflow. (It may not be 100% accurate, but will be modified later, if needed) It is well established, but not optimised. A data provider may use a metadata authoring tool hosted at one of the CLARIN centres. The typical examples are ARBIL in the Netherlands, COMEDI developed in Norway and the submission form of DSpace as developed in Czech. It provides an easy-to-use GUI web interface where a CMDI profile can be imported or generated and metadata records can be created. When generating a profile, the degree of computation for the interaction with Component Registry may vary. For example, COMEDI users need to create a brand new profile, they have to register the profile first in the Component Registry in order to import it to COMEDI. Each of the tools more less tightly integrates with the underlying repository, where the metadata is stored together with the actual resources in one digital object. The metadata is exposed via an OAI-PMH endpoint from where it is fetched by VLO harvester on a regular basis. However, while the authoring tools try to provide a local control over the quality of the metadata (offering custom auto-complete functionality and various consistency checks), a common, formal and rigorous mechanism for VLO data ingestion is lacking to control the quality of metadata which VLO team is struggling to cope with. The ability of these applications is limited to synchronise and interoperate with four extra CLARIN services, namely Centre Registry, Component Registry, CLAVAS, and CCR. In particular, CLAVAS is not used as authoritative source of controlled vocabularies. There is also almost no feedback from VLO team (automatic or manual) after data ingestion, thus the data providers are required to make quite some effort to improve the metadata quality by individual consultation.
OLAC and CMDI are the two formats allowed to be imported into VLO environment, and the former is converted to CMDI by a predefined mapping. When CMDI is ready, it is being ingested into the solr/lucene index, governed by a set of configuration files: facetConcepts.xml dealing with the mapping of elements to facets (via concepts) and a set of text files defining the normalisation of values. These files are the essence of the CMDI-VLO facet mapping, and, in principle, edited manually by the VLO curators. The processed data will be indexed and published seamlessly on the VLO website, where the end users can browse and search data. The VLO curators also have some difficult time to control the data quality, because they have to manually edit raw files (XML or CSV alike) of concept mapping and value mapping and normalisation, in conjunction with the external CLARIN services. They also need to examine the outcomes on the public website to check the data integrity.
Known issues and potential solutions:
| When? = | What? | Solutions? |
|---|
The following sections will try to resolve the issues above, implementing the solutions.
Optimised VLO data workflow
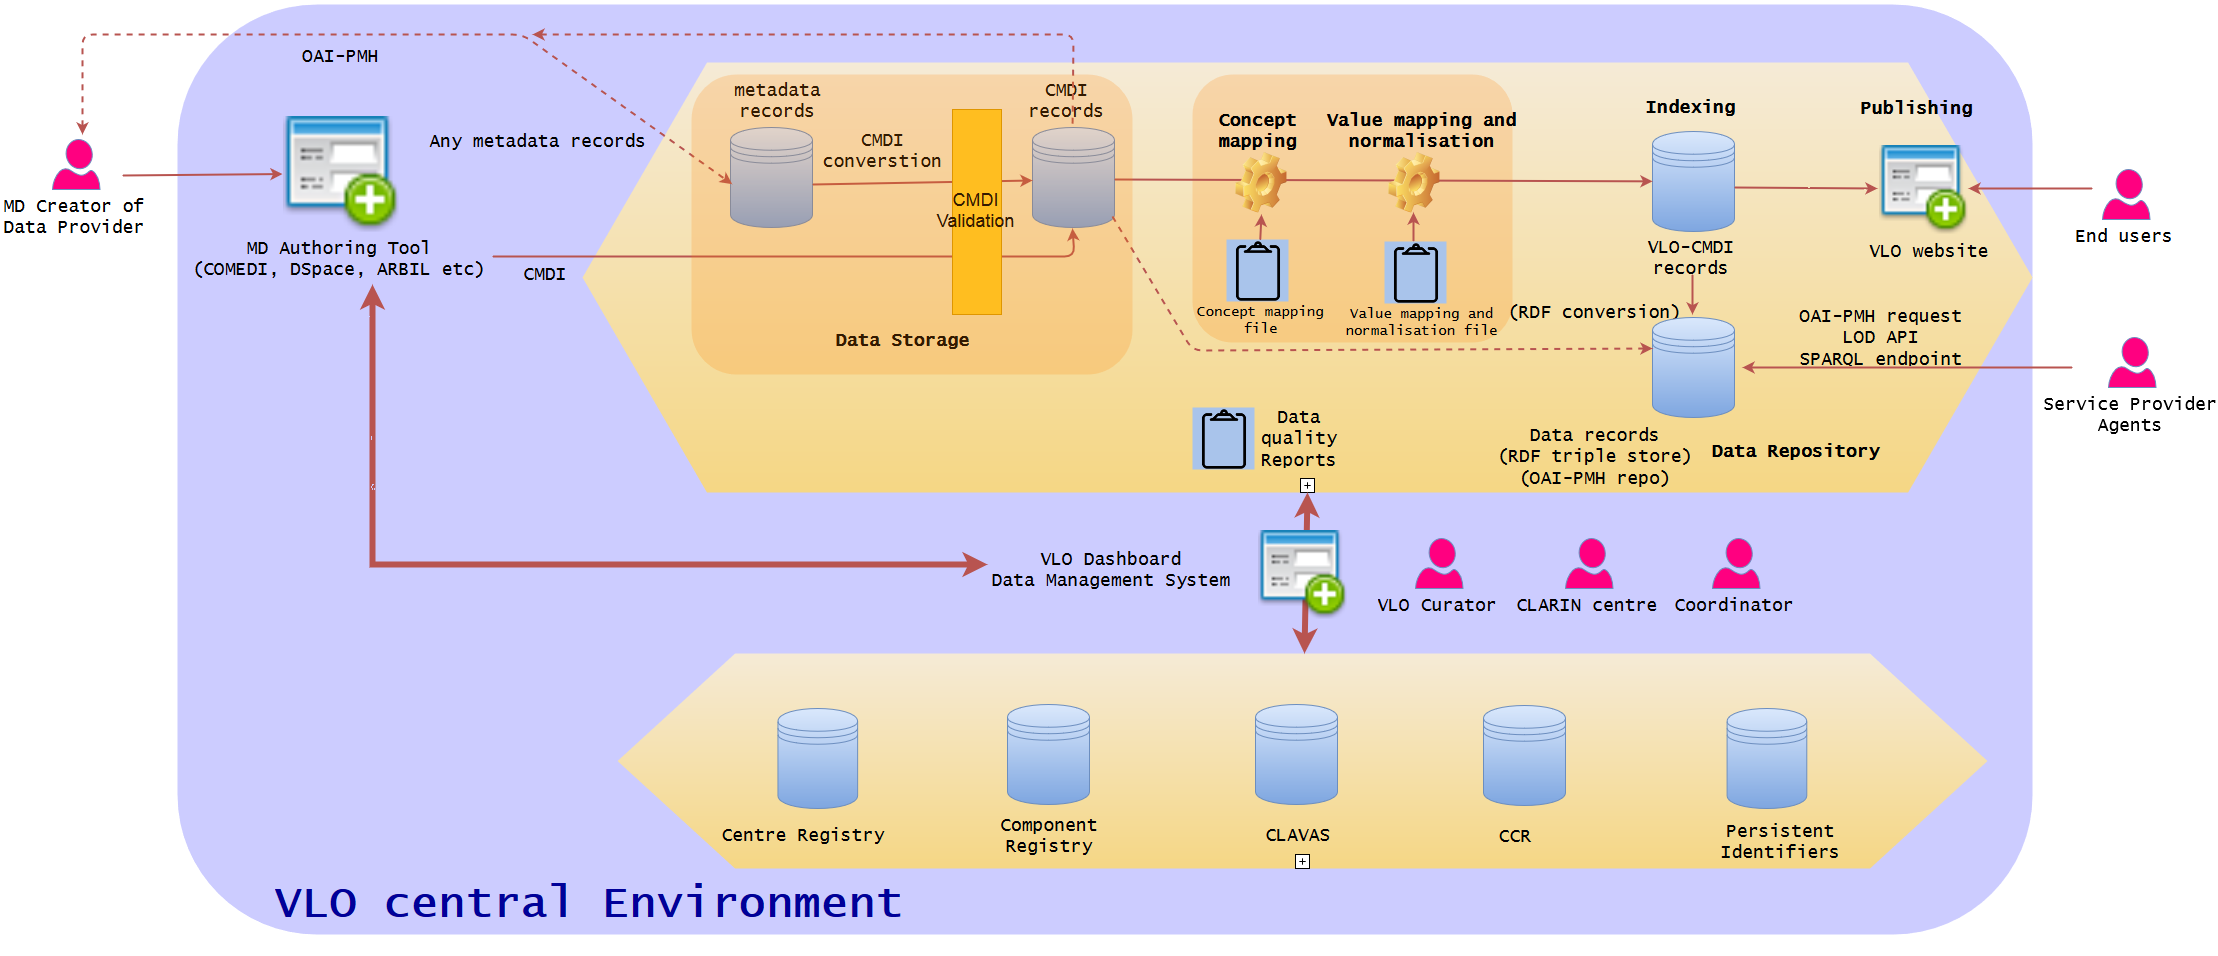
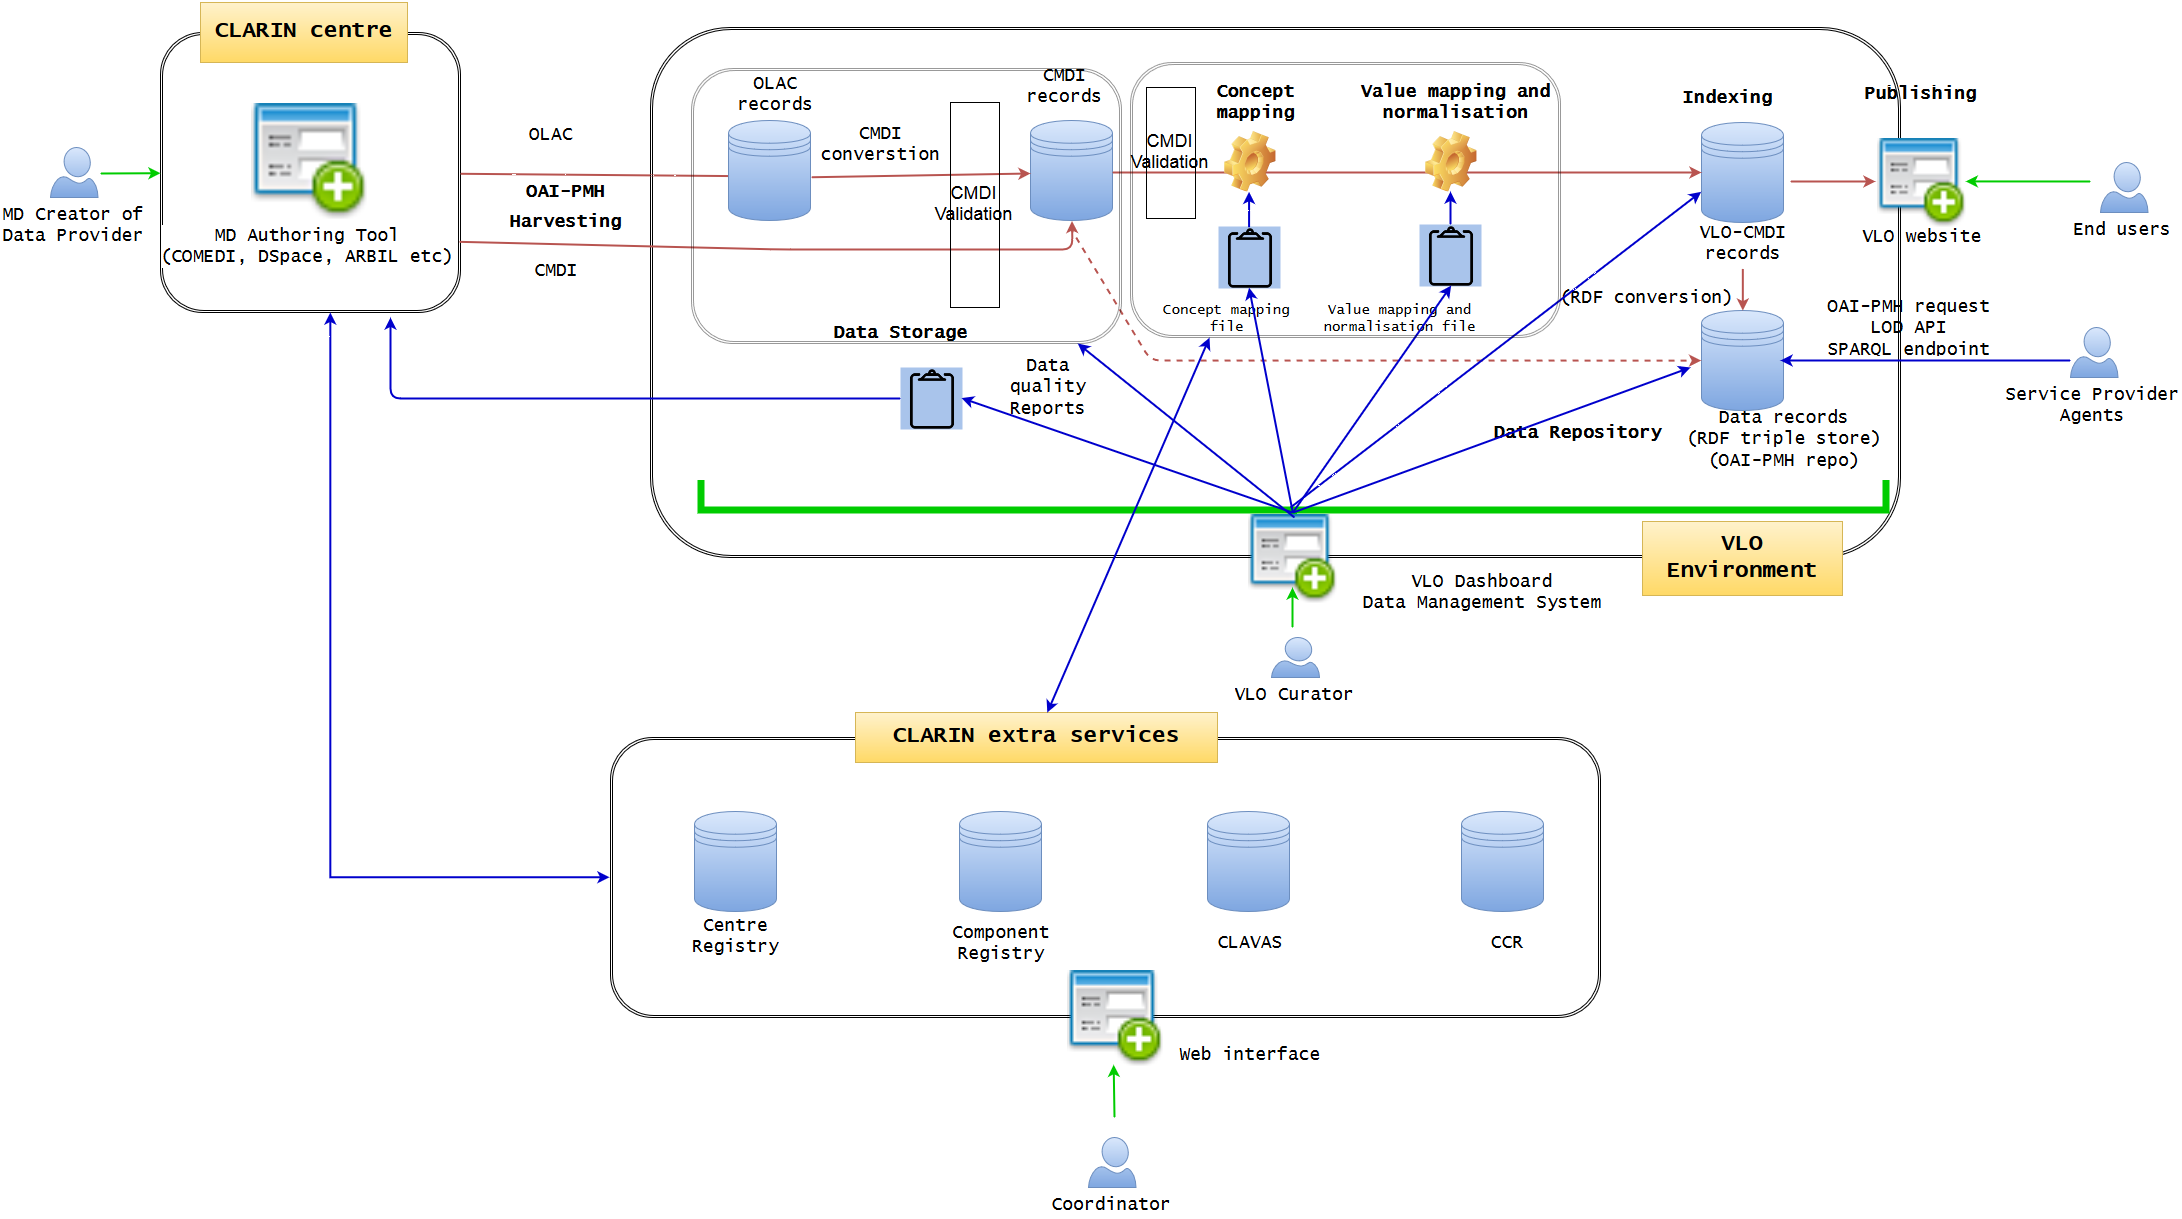
This section will highlight two main tasks of development illustrated in Figure 2: 1) VLO Dashboard data management system and 2) enhanced MD authoring tool. In terms of implementation, it seems most natural to ask VLO central developers to work on 1) and CLARIN centers to work on 2), simply due to the current responsibilities of the local and central development, so that the two can be developed in parallel, if doable.

Figure 2 - VLO Dashboard data management system and extended CLARIN centre MD authoring tool (VLO Dashboard will manage the whole data ingestion and publication pipeline, communicating with extra CLARIN services. MD authoring tool will connect to the extra CLARIN services)
The dashboard is the key development of the core VLO framework. It will integrate all the data ingestion pipeline into one, creating a user-friendly GUI web interface with which VLO curator can work on data management much more efficiently and coherently in a uniform manner. Data integrity will be much more guaranteed within the complex data life cycle of VLO in one environment. The Dashboard approach is based on the well-known OAIS model, encompassing the three information packages: Submission Information Package (SIP), Archival Information Package (AIP), and Dissemination Information Package (DIP). It offers a very intuitive data management view, illustrating the step-by-step process of the entire data life cycle, starting from harvesting, converting, and validating, to indexing and distributing. Those who have no strong technical skill should be able to use it in a similar way to organise a mailbox of an email software. The functionalities should include (but not limited to):
- List of the datasets (OAI-PMH sets) bundled per data provider and per CLARIN centres/countries (MUST)
- Status and statistics of the sets within the ingestion pipeline (errors, progress indicator) (MUST) (export as PDF, XML, CSV etc (SHOULD))
- Simple visualisation of the statistics 2), including pie charts, bar charts etc (CLOUD)
- Browse the data quality reports per set (MUST) (export as PDF, XML, CSV etc (SHOULD))
- Send email of the data quality report to a data provider/CLARIN centre (SHOULD) (automatic email (COULD))
- Edit the concept mapping (MUST)
- Edit the value mapping and normalisation (MUST)
- Manual data management (deactivate indexing of the sets, delete the data sets, harvesting of data sets) (MUST)
- Synchronise the component registry, CLAVAS, and CCR with the data sets (MUST)
- Browse the log files of the VLO systems (COULD)
- Browse the Piwik web traffic monitoring (COULD) (do it per data set (CLOUD))
- Link checker which lists broken links (per set) (COULD)
The next figure is created to visualise the idea of Dashboard in which the VLO curators can monitor the whole ingestion process at one glance. OAI-PMH data sets are listed as rows, and can be easily categorised per country and data provider. Following the ID and title, there is a date of latest update (which can be harvesting date or latest actions). The status of data processing is clearly visible with green and red circles (harvesting, converted to CMDI, validated against CMDI). When it is indexed and published, the number of records are shown. When the data is distributed in a repository (eg OAI-PMH, LOD etc), it is also indicated. The last, but not least, the data quality is provided with the indication by stars. More detailed specifications of the Dashboard status indicators can be found in the Dashboard statistics. Different actions will be selectable, according to the status of the data. Some ideas of the actions are:
- (Re-)harvesting of the data set
- Disable indexing
- Delete the data set
- Show the data quality report (various statistics e.g mapping coverage, facet coverage, controlled vocabulary coverage, broken links etc)(download them as PDF, CSV, etc)
- Show the error messages (download them as PDF etc)
- Show the metadata sets
- Show the schema/profile (with the link to Component Registry, CLAVAS, and CCR)
- Send an email to the data provider (eg data quality report)

Figure 3. Dashboard overview of data ingestion process
As well as the single data set actions, there will be batch processing options. The users can search, sort, and filter the data in this table view. In addition, s/he can select multiple data sets by clicking the checkboxes on the left. With this table view, the user should be able to see the overall statistics (and/or selected data sets), including the number of datasets, countries, data providers, the status, the number of records indexed and distributed. Those figures are extremely important for the performance indicators (for CLARIN board etc). The user should also be able to export the statistics as PDF and CSV or directly into Google Spreadsheet (this is useful to work with internet traffic statistics of Google Analytics or Piwik).
Be aware that the Dashboard will provide manual data processing functions, but it is just a complementary service of the automatic data processing (as it is currently implemented). It will serve as a very important support for the automatic processing, because the VLO curators can monitor the data and manually interact with it without any knowledge of behind-the-scene codes and scripts, whenever it is needed.
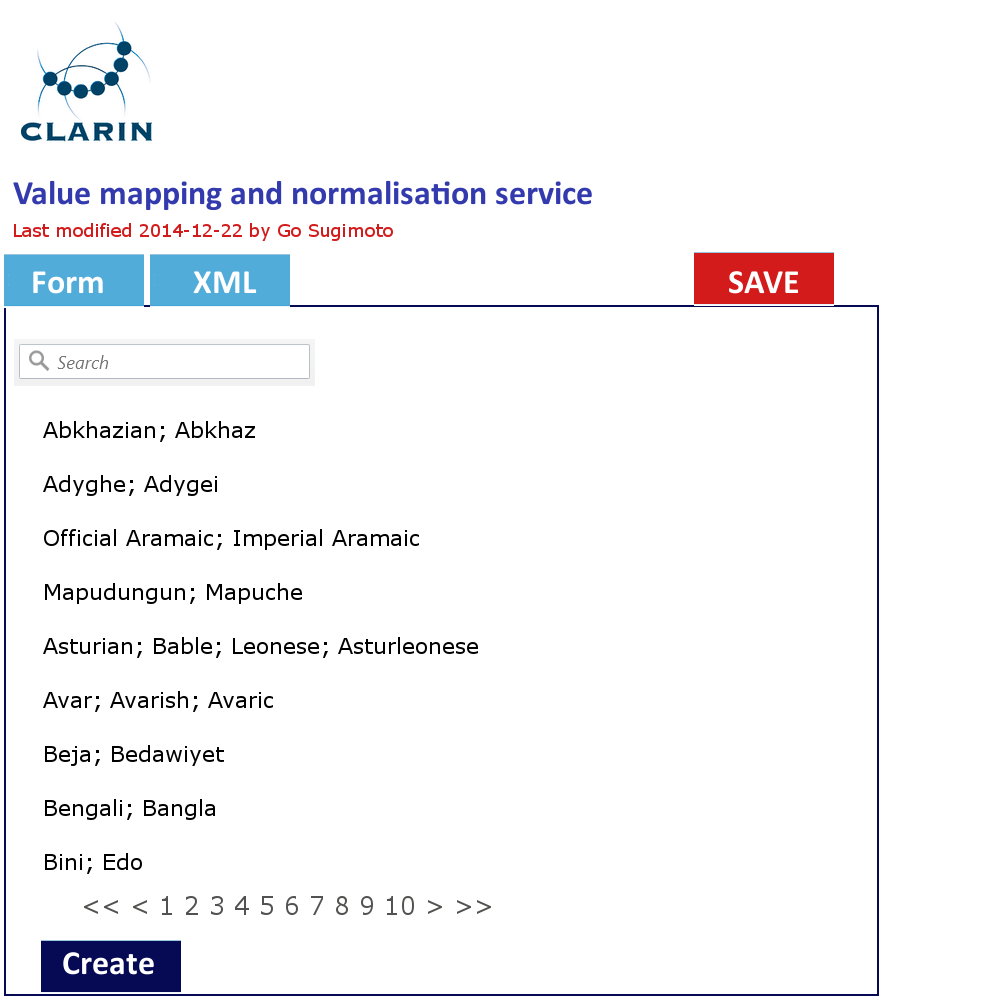
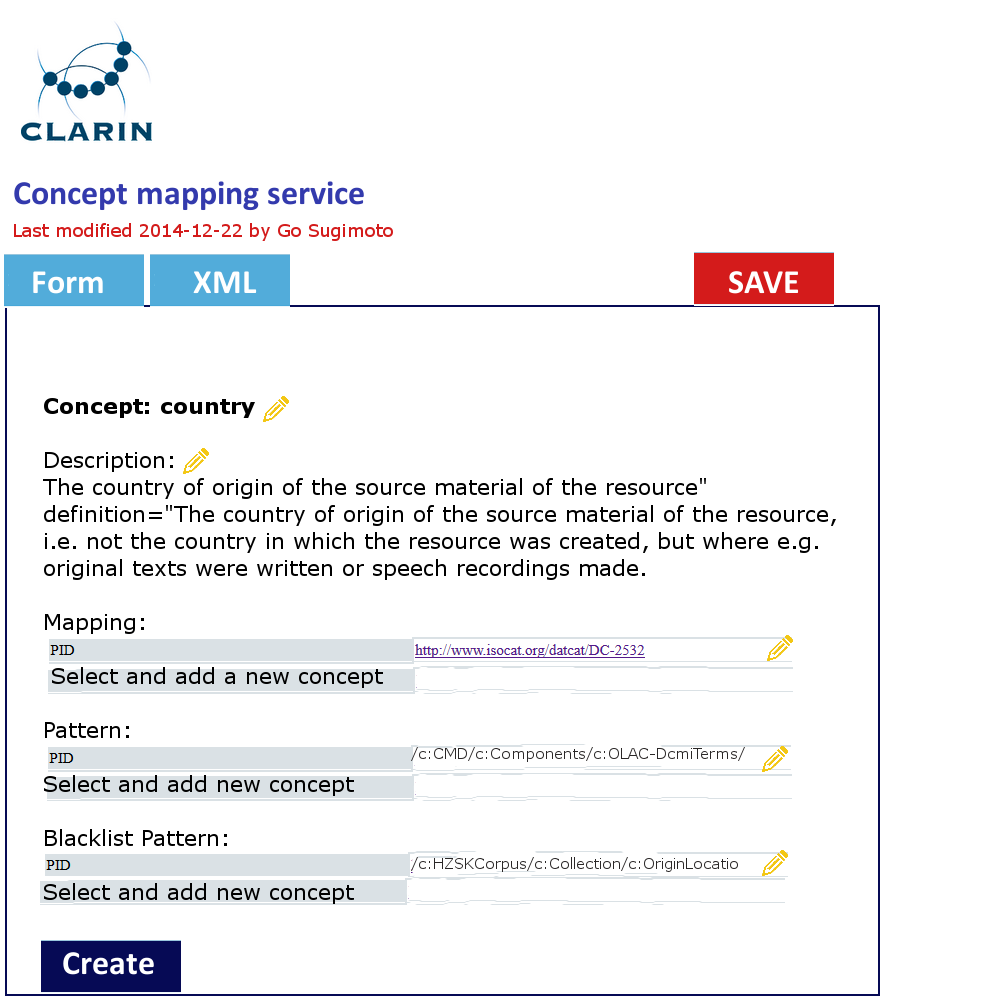
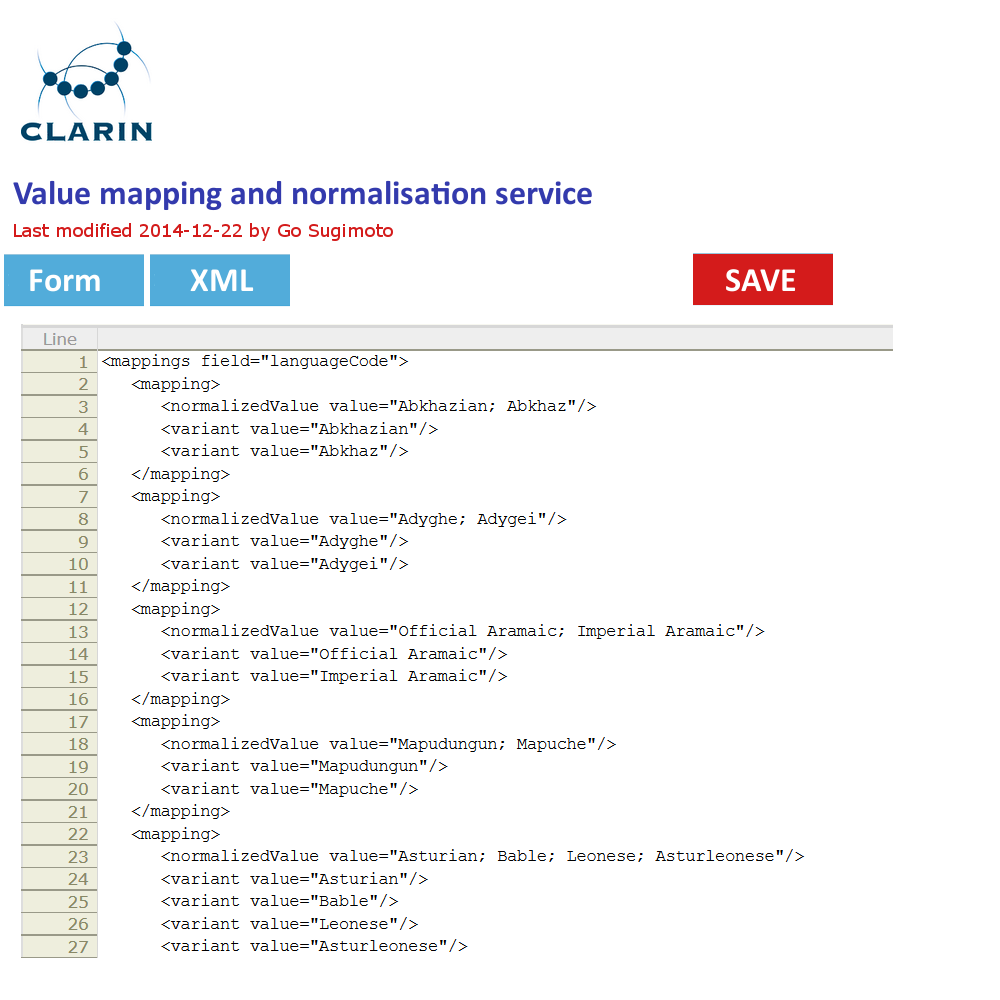
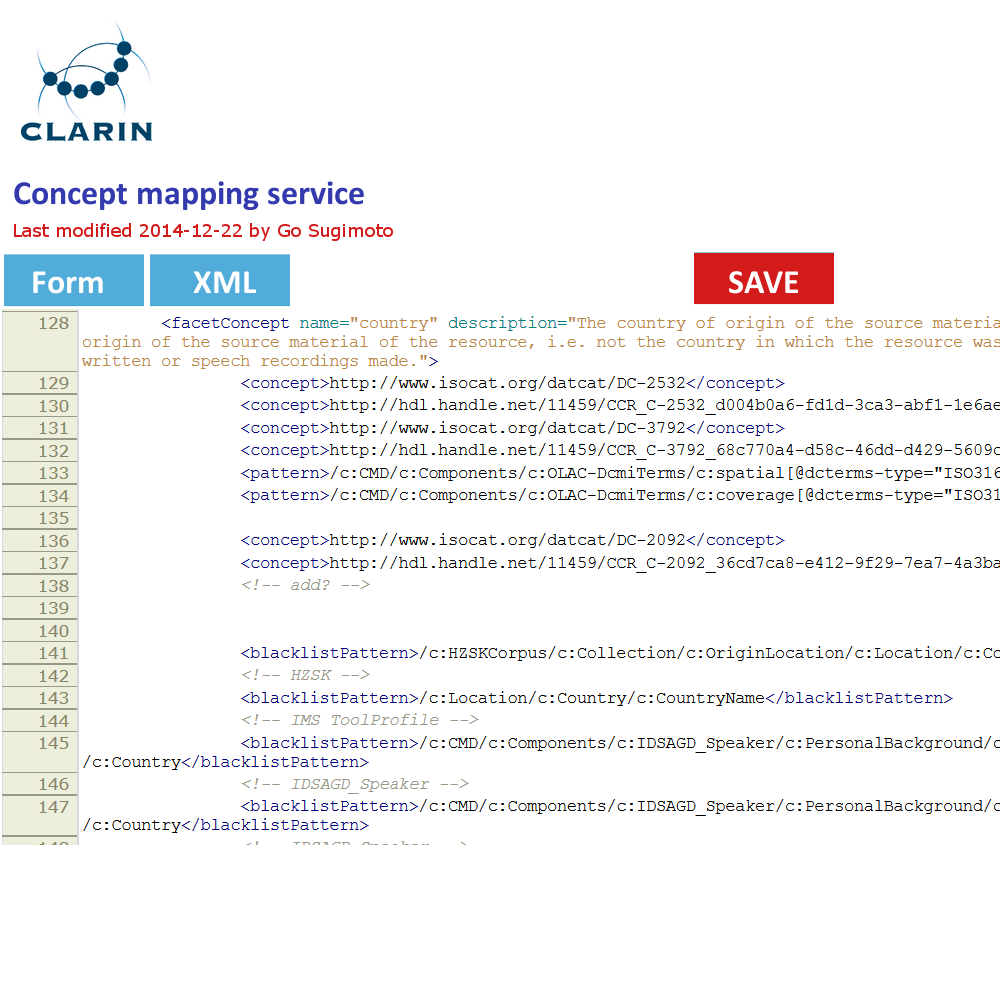
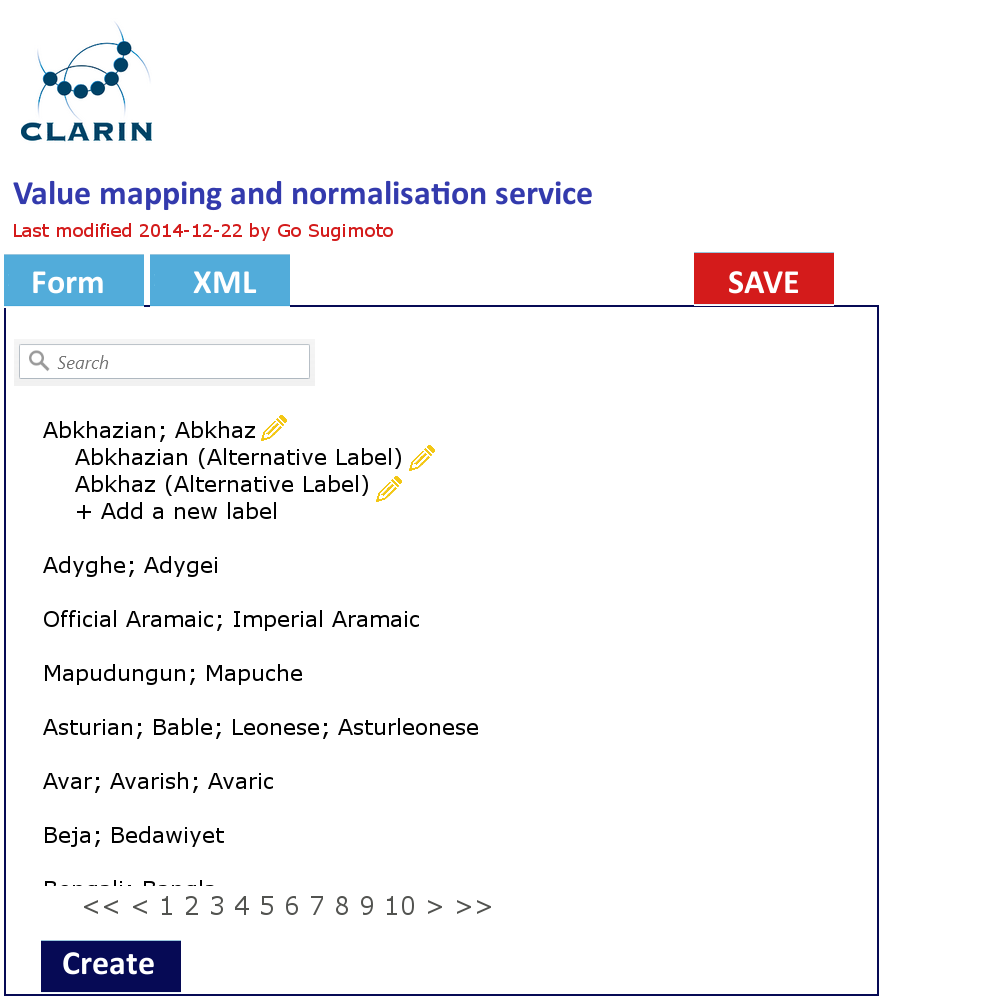
In addition to the data management view of the Dashboard, it can offer a very simple GUI tool (eg a web form interface) to create and edit the concept mapping and the value mapping and normalisation (See figures below). It should translate the data filled into XSLT files (or equivalent) with which the data transformation/mapping will be carried out. Direct XML editing is also possible. The tool will reduce the work involving CSV, TXT, XML, XSLT by introducing a simple yet powerful collaborative web service within the Dashboard framework. Desirably, the editing in the form will not just typing a value itself, but provide a modal window to search and select from relevant extra services (CCR, CLAVAS) (note: there is no mock-up below for this function), so that the curator can double-check with and controlled by the mapping and normalisation values via API/auto-complete.
Figure 4. Concept mapping interface in line with the XML code structure
Figure 5. Value mapping and normalisation interface in line with the XML code structure
The enhanced MD authoring tool will communicate with the extra CLARIN services including the (Centre Registry), Component Registry, CLAVAS, and CCR. The base of this tool already exists in different CLARIN centres. COMEDI in Norway and DSpace in Czech/Poland? are two of the good examples. The new tool may include the functionalities as follows (but not limited to):
- Import of Component Registry CMDI profiles (especially the recommended profiles which will be defined by the curation team soon) and selection of them to create metadata (MUST)
- Export of a new CMDI profile defined by a data provider to the Component Registry, and save it in there (MUST)
- Use of controlled CMDI components/elements (mandatory fields and occurrence etc), when defining/editing a profile (MUST)
- Browsing CCR concepts and create a link, when defining/editing a profile (MUST)
- Simulation of VLO display based on the defined profile (MUST)
- Import and export of the XML Schema of a CMDI profile (SHOULD)
- Use of controlled vocabularies (CLAVAS) when filling the metadata records (MUST)
- Browse the data quality report based on the metadata created. If the data is not compliant, it will include warnings to explain the consequences. (SHOULD)
- The MD authoring tool (including the enhanced functionalities above) will be modualised to be split from the local application, so that it can be re-used in other CLARIN data providers and centres, as well as the future possibility to be included in the CLARIN central environment (see Phase III). (COULD)
- Link checker which lists broken links (COULD)
Mockup will be inserted here
Alignment with the ongoing software development and documentation plan
The idea of this document is not intended to interrupt individual software projects and CLARIN PLus tasks. In particular, it concerns about T 2.2 Metadata quality improvement which consists of T 2.2.1 Metadata benchmarking and curation, T 2.2.2 Improved harvesting workflow, and T 2.2.3 Reinforced concept registry. It is perfectly possible to co-exist and take advantage of the existing and ongoing developments. The core of the workflow framework described in this document is the Dashboard. It can be regarded as a viewer or user interface which fetches various types of data the software modules produce. For example, the Dashboard needs data from the OAI-PMH harvester module to visualise the status of the each dataset and manage them in one interface. The curation module will help the Dashboard to monitor the status of the ingested data and produce quality reports about mapping, normalising, and indexing. There is no harm if the modules provide services to supply the same (types of) data to the third parties (eg via API). The primary concern of the Dashboard is the VLO curation team, but the Dashboard will be in synch with the CLARIN extra services managed by their coordinators to ensure the mutual and dynamic data update. With regard to the data providers, the Dashboard will eventually communicate with the metadata authoring tools or local applications to connect to the corresponding modules and services.
It is also very important all the technical implementation in this document follows the VLO guidelines and recommendations which will indicate what to be done to organise and manage the metadata for the sake of the end-users.
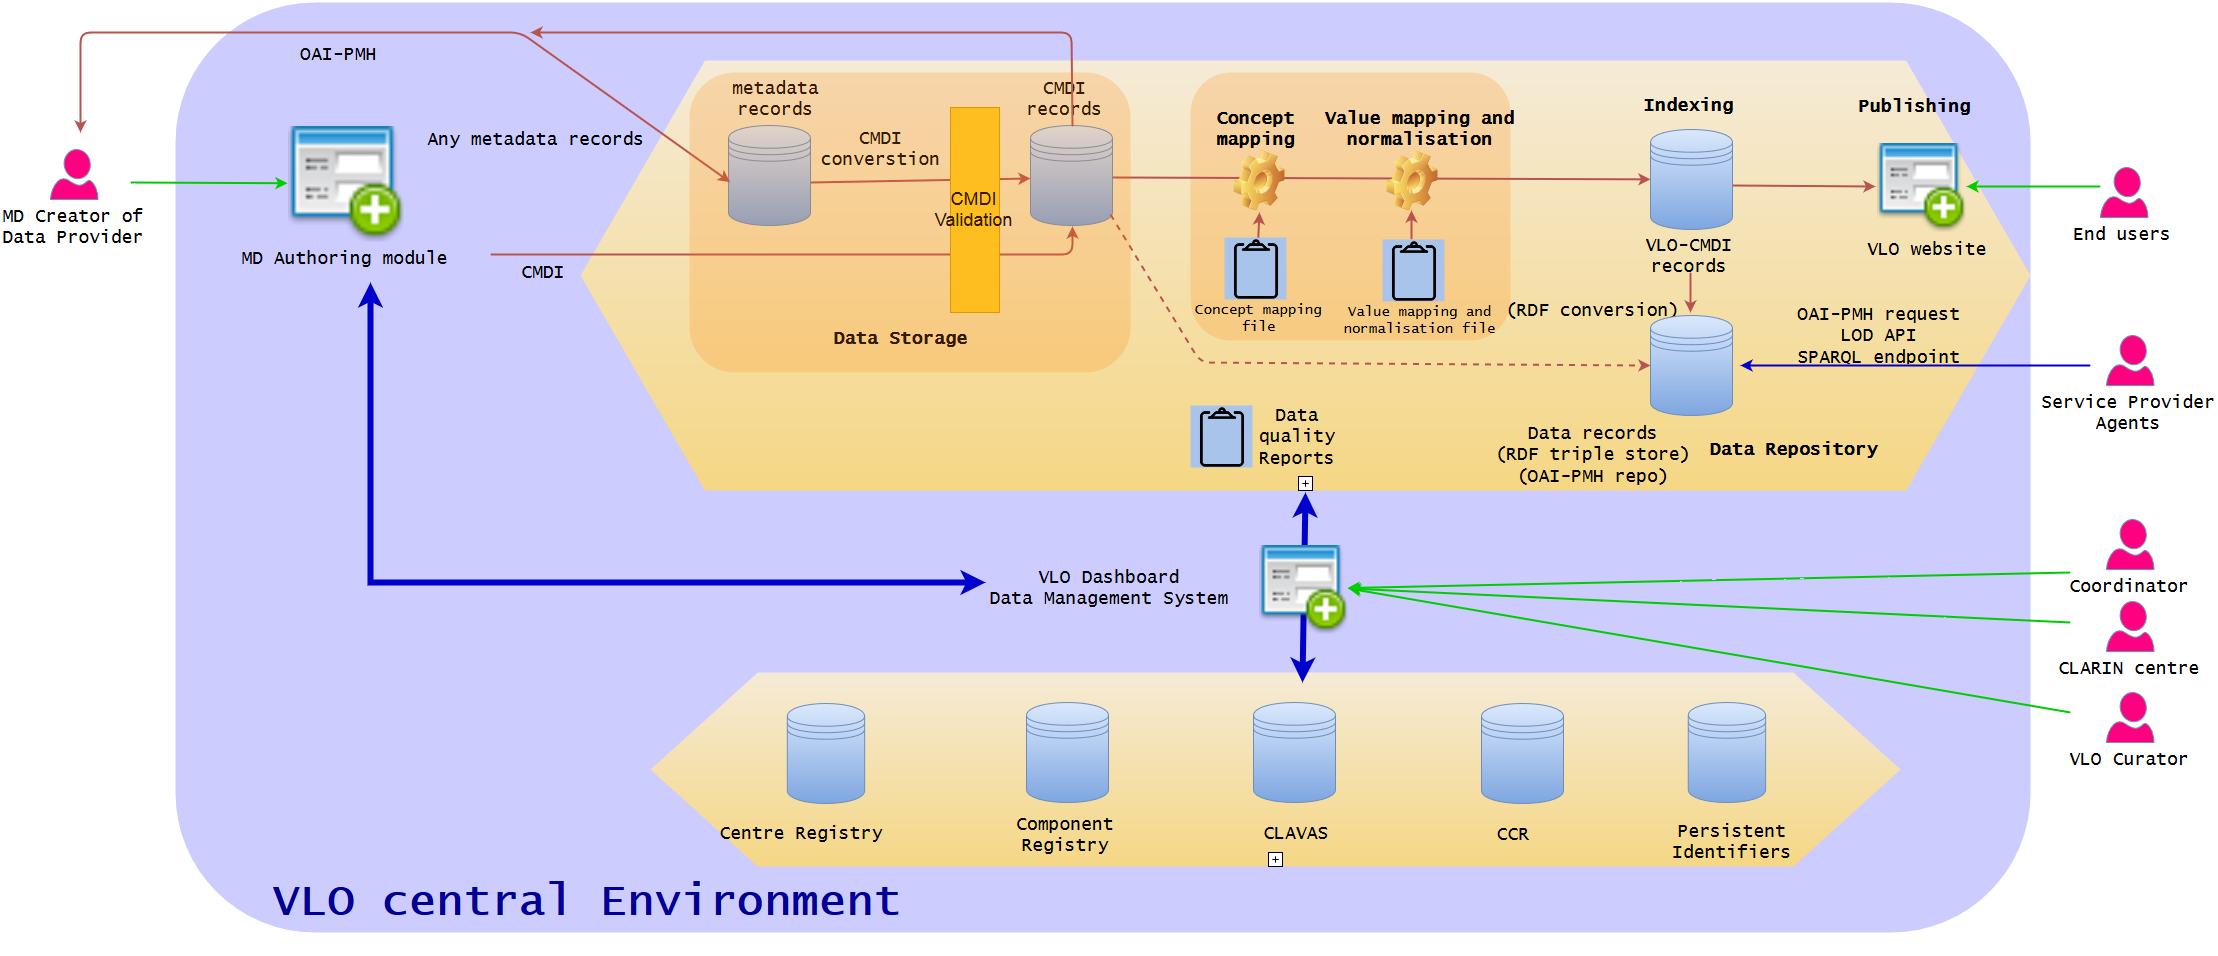
After a meeting 2015-11-11 (Menzo, Dieter, Davor, Matej and Go)
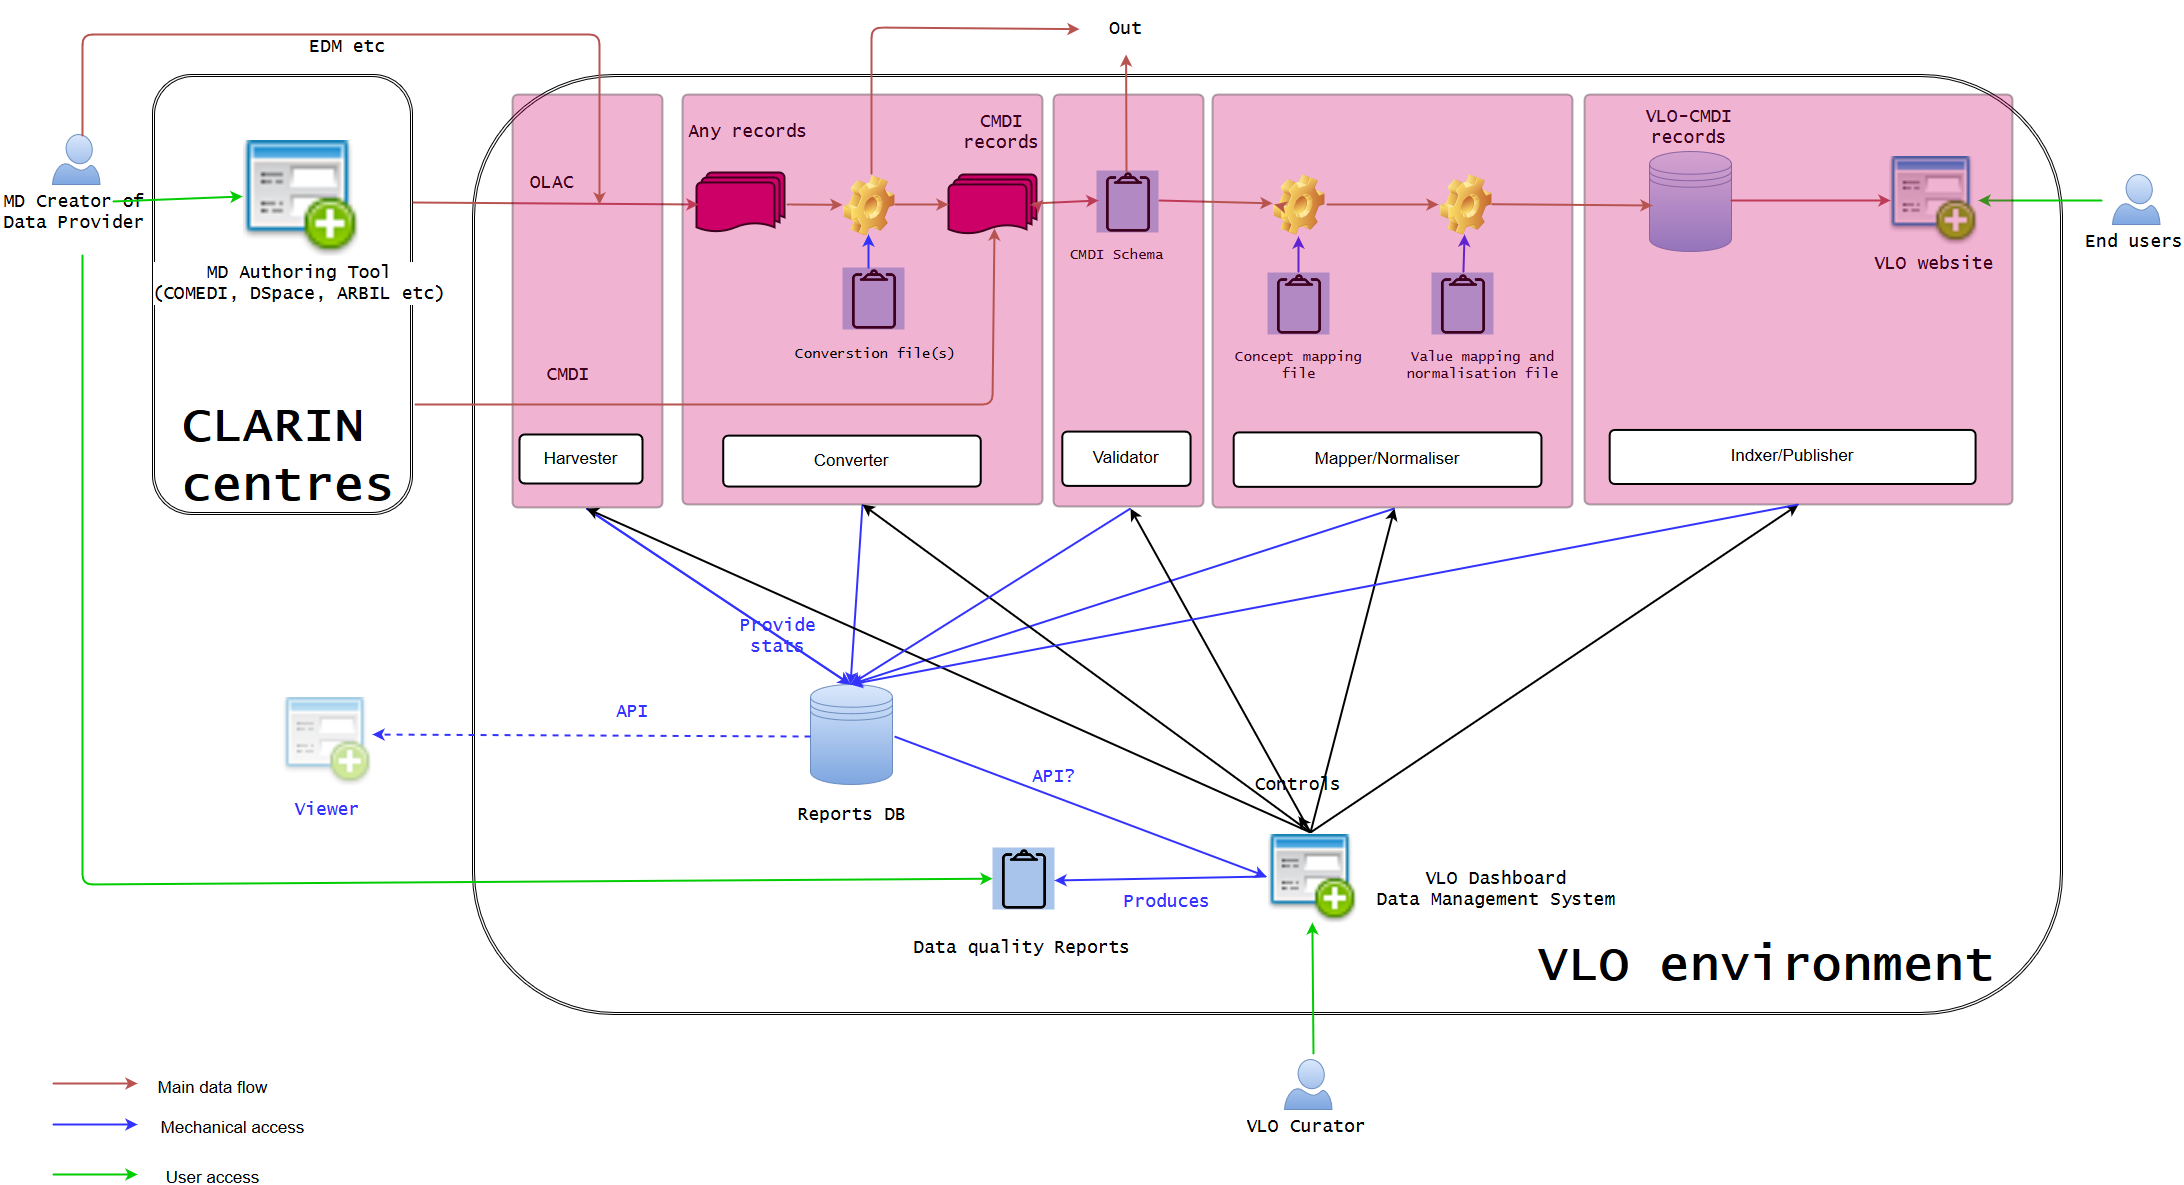
This is the new diagram that Go comes up with after a technical discussion, which focuses on the Dashboard part. It may be different from what others think, but he thinks that the more modualisation of data ingestion steps will make the process much clearer. In his opinion, the roles of current harvester+viewer and curation modules in relation to other part of the VLO ingestion are a little under-specified and overlapping, therefore, the diagram is an attempt to clarify a bit more what module/component will work on what in order to produce the expected results in the Dashboard in the future.

One of the important aspects toward the Dashboard is that it has two primary functionalities. The first functionality is to control all the ingestion modules (harvester to indexer), so that it can, for example, manually stop the harvesting, or changes the mapping definition, and re-index the published data sets. It will serve as an additional service to the current almost full-automatic ingestion. The second functionality is to monitor the ingestion process. That means each module will communicate with the reports database to provide statistics about a particular data transaction. For instance, harvester will supply the statistics about the outcome of the harvesting, while mapper/normaliser will tell the coverage of facets and controlled vocabularies. Validator may check the broken links, whereas indexer will tell the total number of indexed records. Based on this database, the Dashboard will be able to produce data quality reports which can not only be viewed in the Dashboard itself, but also in a PDF file which each data provider can access. The reports database could provide API for internal and external services to create a viewer (eg harvesting viewer), but it is optional, because the Dashboard is the main interface to include all in one.
Reference
The initial idea is developed under another document https://docs.google.com/document/d/1OoxDEFoZKhmotk7tbrElqcn79acKnj4T897sNctMYH8/edit?usp=sharing in which you can see the idea of even further future. It is always good to take long-term strategies and visions into account, when developing the most urgent features, so that it will be less time-consuming to move on to a next step.
Attachments (19)
- Copy of Current VLO data workflow.png (176.4 KB) - added by 9 years ago.
- Copy of Go - VLO data workflow_longterm.png (177.1 KB) - added by 9 years ago.
- MappingInterfaceForm.png (66.8 KB) - added by 9 years ago.
- ConceptMappingInterfaceForm2.png (89.5 KB) - added by 9 years ago.
- MappingInterfaceXML.png (91.9 KB) - added by 9 years ago.
- ConceptMappingInterfaceXML.png (115.2 KB) - added by 9 years ago.
- ConceptMappingInterfaceXML.2.png (115.2 KB) - added by 9 years ago.
- MappingInterfaceForm.2.png (66.8 KB) - added by 9 years ago.
- MappingInterfaceFormSelected.png (73.3 KB) - added by 9 years ago.
- Go - VLO data workflow(3).png (195.4 KB) - added by 9 years ago.
- Go - VLO data workflow(2).png (204.4 KB) - added by 9 years ago.
- Dashboard_UI_MockUp.png (52.0 KB) - added by 9 years ago.
- VLO data workflow current .png (167.5 KB) - added by 9 years ago.
- VLO data workflow Phase 2 .png (214.2 KB) - added by 9 years ago.
- VLO data workflow Phase 3.png (191.8 KB) - added by 9 years ago.
- VLO data workflow Phase 1.png (193.1 KB) - added by 9 years ago.
- WorkflowNow.png (180.5 KB) - added by 8 years ago.
- Workflow2.png (210.2 KB) - added by 8 years ago.
- Dashboard workflow.png (227.6 KB) - added by 8 years ago.
.png)
.png)
.png)
.png)